
What Is Any Agentic Architecture Actually Worth, Anyway?
A Pharma Company Case Study Tests Ten Agentic Designs Against the Same Crisis

This is the first of three pieces that, together, ask one question from three angles: when an organisation adopts agentic AI, where does the impact actually land, and how big is it really, or how big is it really expected to be? These questions are critical given much market froth and excitement around “agentic systems”. I care less about the numbers than about the debates, direction, and strategies that may be applied.
Title: What the Architecture Is Worth (This piece)
A $12 Billion Pharma Company Tests (Ten) Agentic Designs Against the Same Crisis— readers walk away with: how to think around what an architecture choice is worth. You should walk away with more questions than answers, which is the point of the exercise — which of various AI designs wins, loses, or fails outright when tested against the same crisis, and the enterprise-value gap between them.Two Economies, One Technology
Why the Same Technology Caps Out as a Saving in One Function and Opens Into a Bet in Another— readers walk away with: a better way to judge whether an AI claim about their industry is plausible — why the same technology produces a small, capped saving in one function and a large, uncertain bet in another, and which is which.The Funnel, the Floor, and the Structure
"A Value-Chain Framework for Where AI Impact Lands"— readers walk away with: a three-part map for locating any AI effect, in any sector — so the next AI headline can be sorted into “bounded saving,” “long-shot bet,” or “who-gets-paid shift” before deciding how much it matters.
This piece starts with the narrowest, most concrete version of that question — inside a hypothetical single $12 billion pharmaceutical company, facing a real supply-chain crisis, what is the difference in enterprise value between choosing the right AI architecture and choosing a “plausible-but-wrong one”? By now, you would have realized that not all “agentic designs” are created equal! It builds on the foundation of the “Harness Lab Series” (more references found below, but you can start with the link provided and unwind things from there).
Given how young the space is, the analysis does its best to hypothesize, but the real value should be in organizations potentially using this as a helpful guideline (which you can tweak as thoughts arise, and the specifics of your businesses and strategies are ironed out), basically, scenario planning around how the allocation of resources towards Agentic AI, might pan out. What risks to look out for, and how the organization itself might prioritize team or departmental adoption, including setting up a strategy around it. Use it as you see fit.
The second piece, "Two Economies, One Technology," picks up the answer from this case study and asks why it (investments in Agentic AI) might feel smaller than the claims circulating about AI's economic impact — arguing that the answer depends on which part of a business, and which industry, is doing the talking.
The third piece, "The Funnel, the Floor, and the Structure," completes the arc with a framework for locating any AI-driven effect, in any sector, by where it sits in a value chain — and shows, in hindsight, that everything measured in this first piece was one specific kind of effect all along. Read in sequence, the three pieces move from one company's balance sheet to an industry-spanning map; read on its own, this piece is a self-contained case study of what ten different agentic architectures are actually worth when tested against the same crisis.
How to Read This Case Study
This case study has two layers, and keeping them separate is the key to following the argument. The first layer is a piece of research: ten AI “harness” designs — numbered H1 through H10 — were built and tested against the same task, and their quality, speed, and cost were measured. That research is real and is documented in the Harness Engineering Series articles referenced throughout. The second layer is this case study itself: a fictional pharmaceutical company, PharmaCo, that uses those same ten harness designs and experiences the financial consequences of choosing well or badly between them.
Every harness discussed in this case is referred to only by its number from the original H1–H10 research “The Harness Lab” and “The Harness Lab, Automated”— there is no separate alphabetical naming scheme here. Four of the ten matter most to the PharmaCo story:
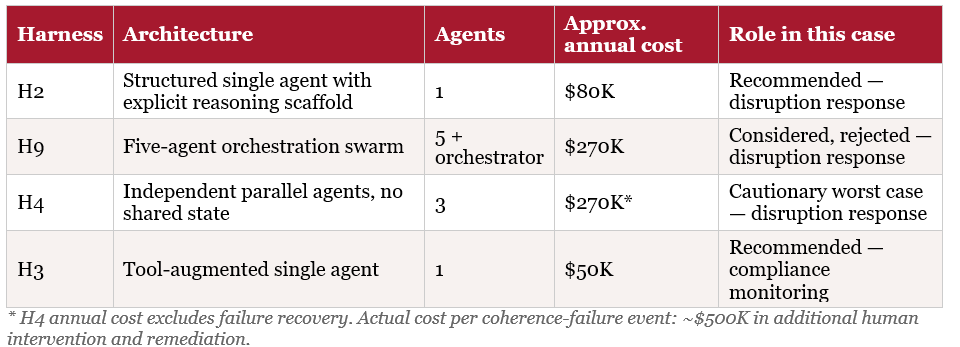
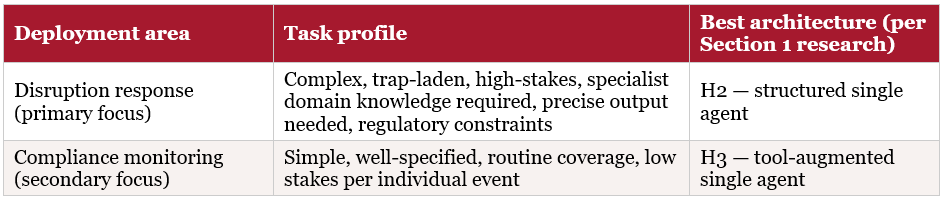
• H2 — a single AI agent following a structured, step-by-step reasoning script. This is the architecture PharmaCo ultimately recommends for its hardest task: responding to a supply chain disruption.
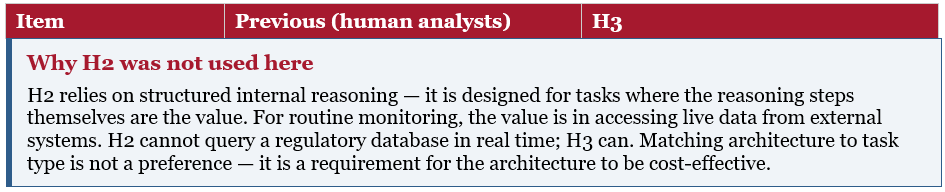
• H3 — a single AI agent that calls external tools (databases, live status checks) as it works. This is the architecture that fits PharmaCo’s second task: routine daily compliance monitoring across 40+ markets.
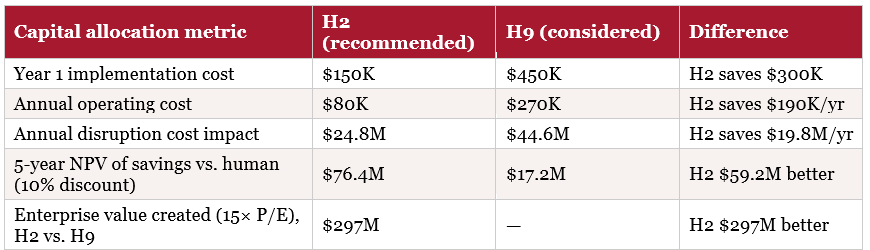
• H9 — a five-agent “swarm” with an orchestrator that divides the task among specialists and stitches their outputs together. This is the architecture PharmaCo’s management initially preferred — and the one that turns out to cost $19.8M a year more than H2 on the disruption task.
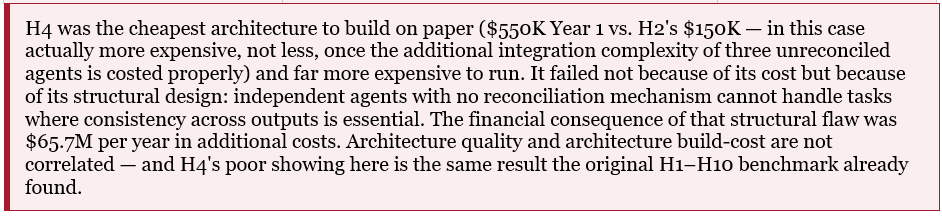
• H4 — three agents working independently on the same task with no shared context, their outputs simply concatenated at the end. In the original research this was the weakest design tested, and it appears here as the cautionary worst case: what happens if an organisation deploys an architecture that looks parallel and thorough but has no mechanism for reconciling contradictions.
The case study is organised in three movements. Sections 1–2 set the scene — who PharmaCo is, what an agentic AI system and a harness actually are, and what the underlying research found across all ten architectures. Sections 3–9 walk through a single disruption event four times — once for each of H2, H9, H4, and H3 — showing what each architecture actually did and what it cost. Sections 10–13 step back to the financial summary, the shareholder-value calculation, and the governance questions the case raises — including a question this revision adds: if agentic AI changes the cost side of the ledger this dramatically, what happens to the people side?
A reminder that the numbers are less important than the depth of discussions and actions that surround scenario planning applied to the implementation of agentic systems. Keep a list of questions that arise, so that these can be applied and tailored to your organizations circumstances. While market hype abounds, think twice before applying. So here it is. Your case study.
Executive Summary
PharmaCo International — an assumed fictional $12 billion global pharmaceutical company — deployed AI agents in two areas of its operations: supply chain disruption response and routine regulatory compliance monitoring. In each area, management had to choose between several possible AI “harness” architectures, and that choice turned out to be one of the most consequential capital allocation decisions the company made that year.
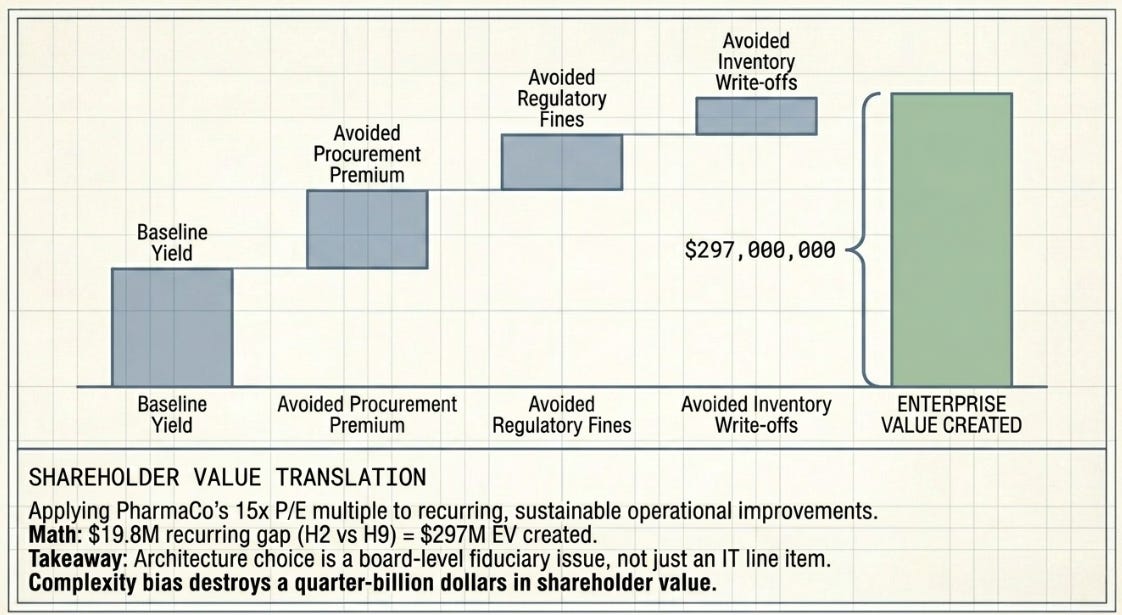
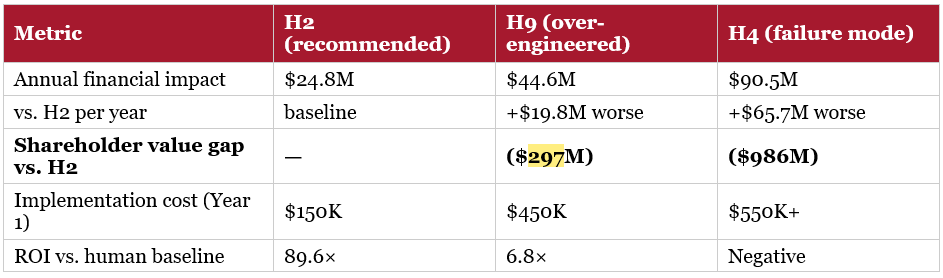
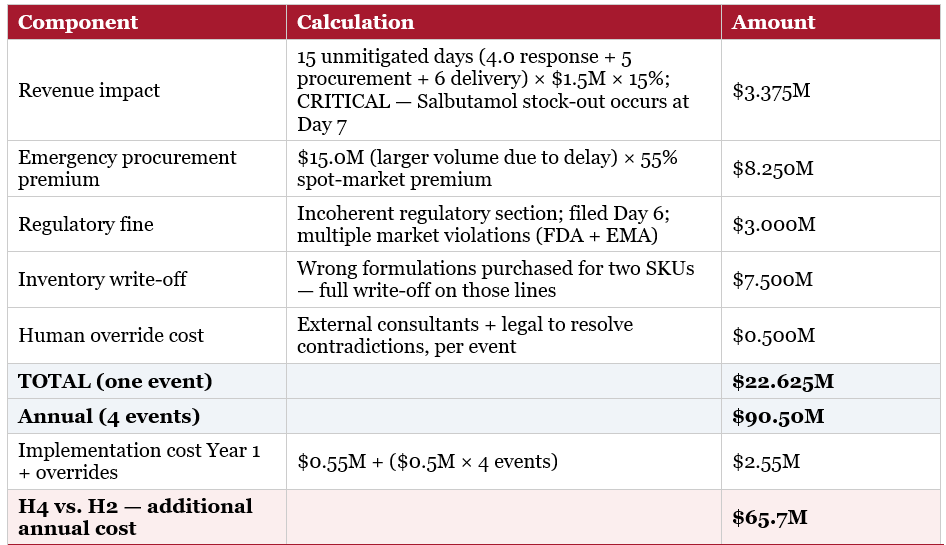
The central finding is counterintuitive. On the disruption response task, the most architecturally elaborate system tested — H9, a five-agent orchestration swarm — produced worse financial outcomes than H2, a single agent following an explicit structured reasoning script. The gap between choosing H2 and choosing H9 was est at $19.8 million per year in avoidable cost, or roughly $297 million in enterprise value at PharmaCo’s earnings multiple. But the difference could actually be wider: ($297M–$986M EV range). A third option, H4 — three independent agents with no shared context — performed worse still: $65.7 million per year worse than H2, and in the original research, H4 was the second-weakest of all ten architectures tested, scoring below the bare-model baseline.
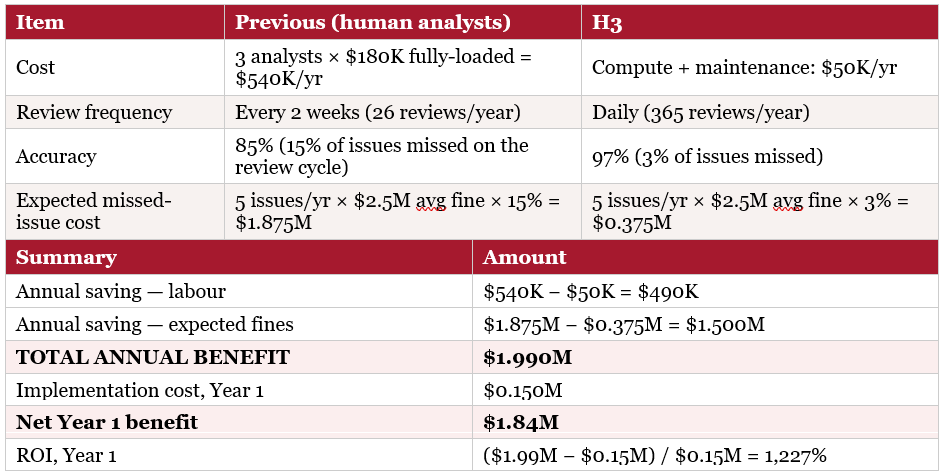
On the second task — routine compliance monitoring across more than 40 markets — the ranking reverses. H3, a single agent equipped with live tool access to regulatory databases, outperforms H2, because the value in this task comes from retrieving current external data rather than from structured internal reasoning. Replacing three human analysts with H3 saves PharmaCo roughly $2.0 million a year while improving review frequency from fortnightly to daily and accuracy from 85% to 97%.
Three findings run through the whole case. First, there is no universally best architecture — the right choice depends on the task, and the same architecture (H9) that loses badly on the disruption task could not even be meaningfully applied to the compliance task. Second, complexity and cost are not the same as quality: H4 was cheaper to build than H2 and far more expensive to run. Third, a system that scores perfectly on a quality rubric is not automatically safe — adversarial testing caught a conditional failure mode in H3 that the standard scoring missed entirely.
Section 1 — The Research Foundation: What H1–H10 Actually Found
Before applying any of this to PharmaCo, it is worth looking directly at the research the case study draws on, because the PharmaCo numbers are a financial translation of these results — not a separate study with its own winners and losers.
1.1 The Original Harness Lab Benchmark
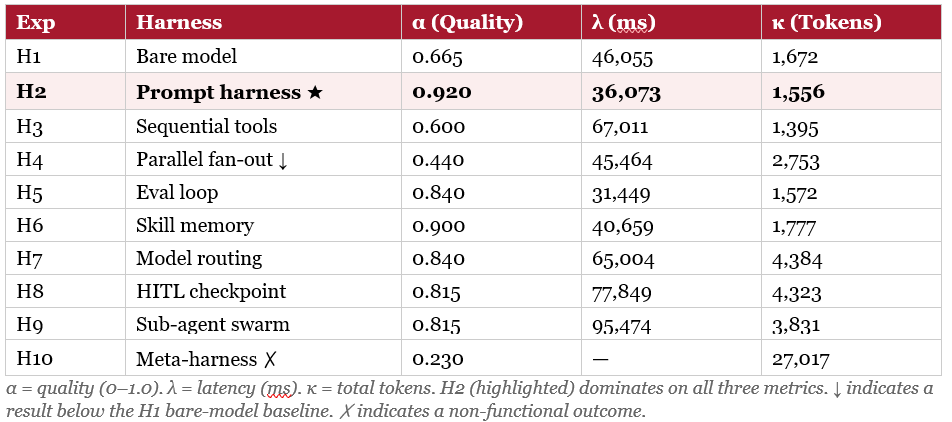
The original Harness Lab experiment tested ten harness architectures — H1 through H10 — against a single benchmark task: producing a disruption response plan for a pharmaceutical supply chain crisis, scored against a pre-specified gold answer with deliberate traps built in (a regulatory deadline, a carrier-specific routing requirement, and a supplier ordering dependency). Three metrics were recorded for every architecture:
• Alpha (α) — quality, measured as the share of gold-answer criteria the system’s output satisfied, from 0 to 1.0.
• Lambda (λ) — latency, the time in milliseconds the architecture took to produce its output.
• Kappa (κ) — total tokens consumed, a proxy for compute cost.
The full results across all ten architectures:
Reading the table
H2 — a single agent following a structured reasoning script — was both the highest-quality result (α = 0.920) and among the cheapest and fastest. It dominates on all three axes. H5 (an agent that drafts, evaluates its own output against criteria, and loops until done) and H7 (an agent that routes sub-tasks to different models) both reached α = 0.840 — strong results, achieved through iteration and tool/model variety rather than a fixed script. H6 (skill memory) reached 0.900, close behind H2. H3 (sequential tool calls) only reached 0.600 on this particular benchmark — useful tools, used in sequence, but without the structured reasoning scaffold that kept H2 on track through the deliberate traps.
H4 (three agents running in parallel with no shared context, outputs simply concatenated) scored 0.440 — below the bare, no-harness baseline (H1, 0.665). This is the headline result that justifies H4’s role later in this case study as the cautionary worst case: it is not merely “not the best,” it is the design that an organisation would have been better off not building at all. H10 (a meta-harness that spawns and manages other harnesses) effectively broke down on this task (α = 0.230, no usable latency figure) and is not carried forward into the PharmaCo narrative.
1.2 The Automated Follow-Up: Workflow Patterns and the Sigma Metric
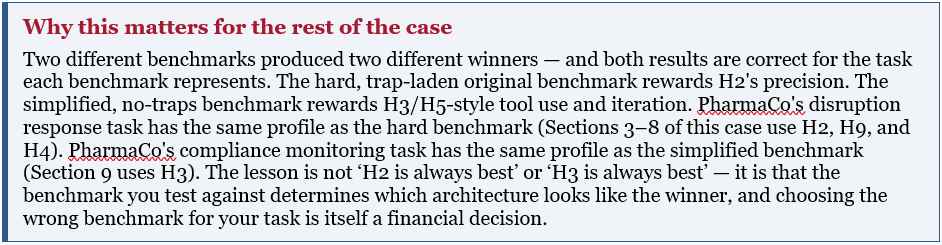
A second piece of research — ‘The Harness Lab, Automated’ — took a different approach. Rather than hand-building each harness, it used Claude Code’s dynamic workflow patterns (fan-out-and-synthesize, loop-until-done, tournament, adversarial verification, generate-and-filter, classify-and-act) to generate, test, and tournament harness designs algorithmically. This second study was deliberately run on a simplified benchmark — the same task family, but with no deliberate traps and a small set of binary evaluation criteria — to test whether the automated workflow tooling itself worked correctly, not to re-run the original hard benchmark.
On that simplified benchmark, the designs that performed best were the tool-using and iterative-loop styles — directly comparable to H3 (sequential tools) and H5 (eval loop) from the original table. This makes sense: on an easy task with no traps, broad tool coverage and iterative self-checking win, because there is nothing precision-critical for them to miss. The structured-script approach of H2 carries scaffolding overhead that pays off on hard, trap-laden tasks but is unnecessary on simple ones.
This second study also introduced the Sigma (Σ) metric — quality divided by a complexity penalty (Σ = α ÷ (1 + Δ), where Δ captures structural complexity such as agent count and coordination overhead). Sigma explains why H2 still leads even against architectures with comparable raw quality: H9’s α = 0.815 comes with substantially more coordination machinery than H2’s α = 0.920, so on a quality-per-complexity basis the gap between them is far larger than the raw α numbers alone suggest.
Section 2 — About PharmaCo International
2.1 Company Profile
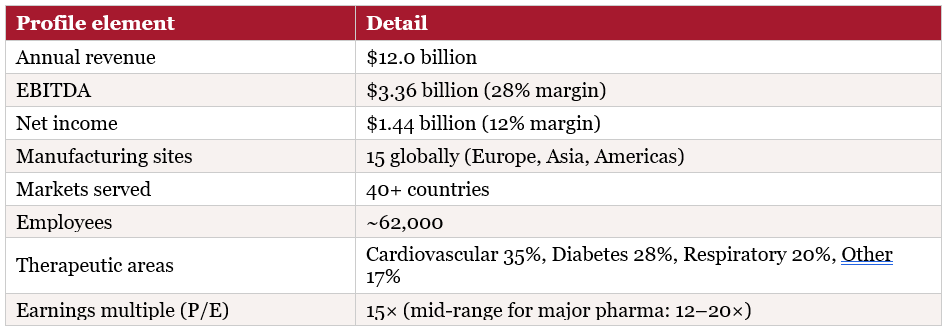
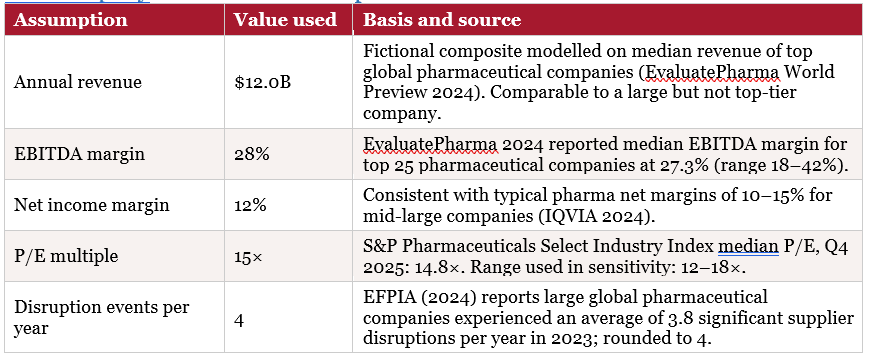
PharmaCo International is a fictional composite of a major global pharmaceutical manufacturer. Its financials and operations are modelled on industry averages for a large-cap pharmaceutical company as of 2026. All figures are illustrative.
2.2 How a Pharmaceutical Supply Chain Works
For readers unfamiliar with the industry: medicines move through a multi-tier chain before they reach a patient.
• Tier 3 suppliers provide raw chemical feedstocks (petroleum derivatives, minerals, plant extracts).
• Tier 2 suppliers turn those into packaging materials and excipients — the inactive ingredients that give a tablet its shape, taste, and colour.
• Tier 1 suppliers produce the Active Pharmaceutical Ingredient (API) — the molecule that actually works.
• PharmaCo’s 15 manufacturing sites combine API and excipients into finished product (tablets, vials, inhalers), which then passes through quality control — every batch tested and regulatory approval required per market — before moving to regional distribution (with cold-chain logistics at 2–8°C for some products) and on to hospitals, clinics, and retail pharmacies.
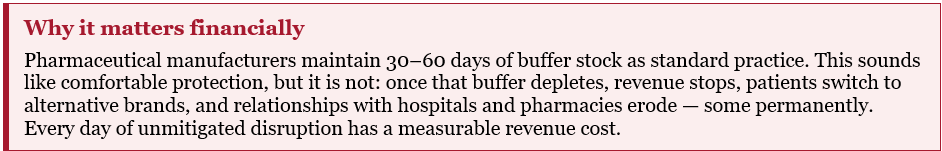
Why it matters financially
Pharmaceutical manufacturers maintain 30–60 days of buffer stock as standard practice. This sounds like comfortable protection, but it is not: once that buffer depletes, revenue stops, patients switch to alternative brands, and relationships with hospitals and pharmacies erode — some permanently. Every day of unmitigated disruption has a measurable revenue cost.
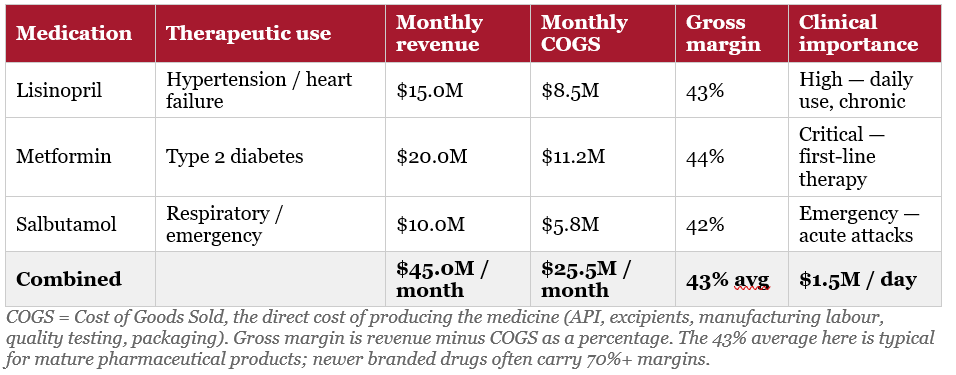
2.3 The Three Products at the Centre of This Case
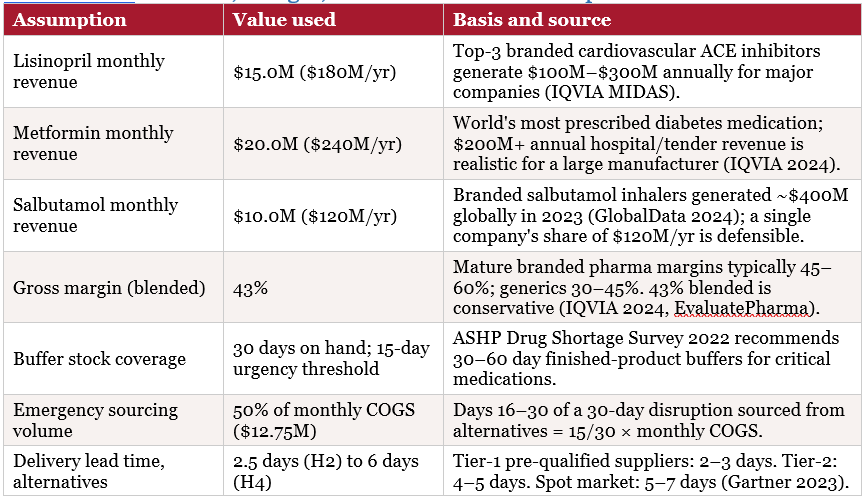
PharmaCo’s Hormuz Strait supplier disruption affected three medications. These are real drug categories — the financial figures are modelled on typical pricing and margins for each category.
Section 3 — What Is an Agentic AI System, and What Is a Harness?
3.1 From Chatbot to Agent
Most people’s experience of AI is a chatbot: you ask a question, it gives an answer. An agentic AI system is fundamentally different. It does not just respond to questions — it takes sequences of actions toward a goal, uses tools, coordinates with other agents, evaluates its own output, and continues until a task is complete.
A chatbot asked ‘which supplier can cover our Lisinopril shortage?’ gives a single response — ‘consider suppliers X, Y, or Z’ — and the human must act on it, verify it, and coordinate the next step. An agent given ‘handle the Hormuz disruption for Lisinopril’ reads the supply data, queries alternative supplier databases, checks regulatory rules, drafts a procurement plan, scores that plan against criteria, revises if incomplete, and files the regulatory notice — arriving at a completed task for a human to review and approve.
3.2 What a Harness Is
A harness is the structural design of how an AI agent — or multiple agents — is organised to complete a task. Think of it as the organisational chart and workflow of the AI system. Two agents given the same task but structured differently will produce different results, at different speeds, with different accuracy, and at different cost.
The harness choice is a capital allocation decision. A simple, well-designed harness costs less to build, less to run, and — on the right task — produces better results than a complex one. A complex harness has higher coordination overhead, more opportunities for errors to compound, and higher compute costs. Section 1 showed the research behind this: ten harness architectures tested against the same benchmark task, with measured financial consequences for each choice.
3.3 The Architectures in This Case
PharmaCo evaluated four of the ten H1–H10 architectures for its two deployment areas. Each represents a different structural approach to the same family of problems.
Section 4 — The Strategic Decision
4.1 Where in the Value Chain PharmaCo Chose to Deploy
PharmaCo did not deploy AI agents everywhere simultaneously. It identified three specific areas of its value chain where the investment case was clearest: supply chain disruption response, routine regulatory compliance monitoring, and inventory replenishment decisions. This case study focuses on the first two.
4.2 Why Architecture Choice Has Financial Consequences!
When most organisations adopt AI, they ask: will it work? The more important question is: which version will work best, and what does the difference cost? The answer, as this case study demonstrates, runs to hundreds of millions of dollars in enterprise value.
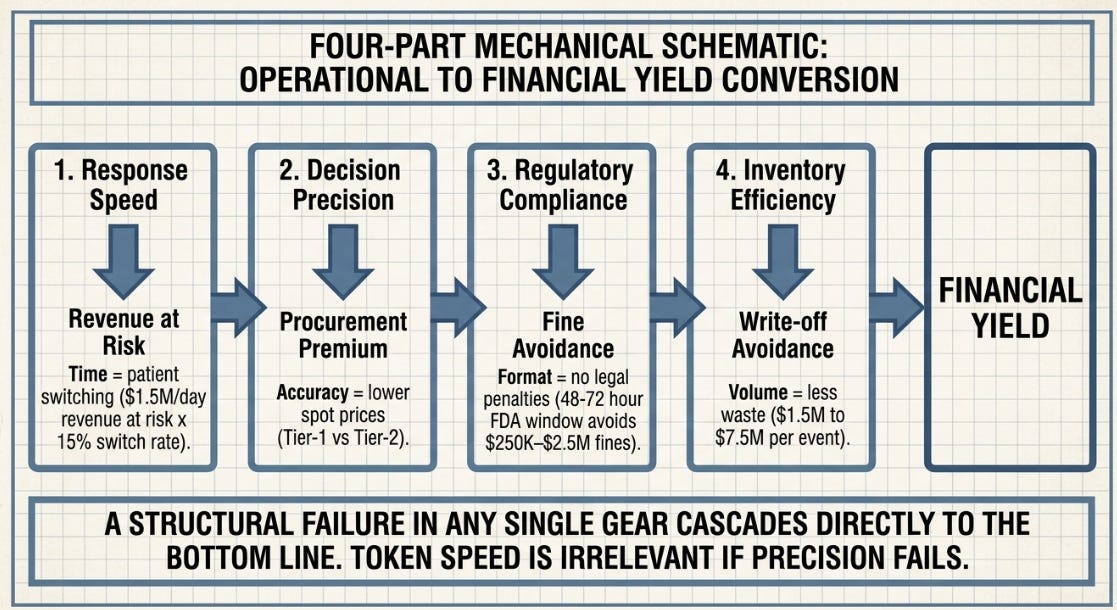
Four financial levers connect harness architecture to P&L performance:
• Lever 1 — Response speed → revenue at risk. The faster a usable response plan is ready, the fewer days of unmitigated disruption, and the less revenue is lost to patient switching.
• Lever 2 — Decision precision → emergency procurement cost. The quality of supplier identification determines the premium paid over normal procurement costs.
• Lever 3 — Regulatory compliance → fine avoidance. Missing a notification deadline triggers fines; a precise, time-stamped action item avoids them.
• Lever 4 — Inventory efficiency → write-off avoidance. Accurate volume and formulation modelling avoids over-purchasing and wrong-SKU write-offs.
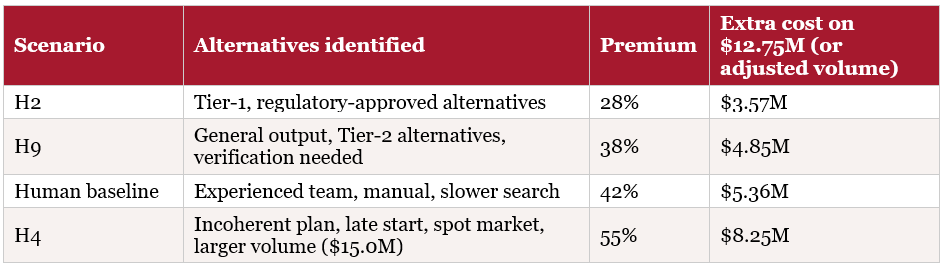
Lever 2 in detail: how the procurement premium calculation works
Step 1 — Define the emergency procurement volume. A 30-day disruption; buffer stock covers the first 15 days. Days 16–30 must be sourced from alternatives: 15 days of COGS. Monthly COGS = $25.5M → 15-day COGS = $12.75M. Emergency procurement needed: $12.75M base volume.
Step 2 — Apply a premium rate that depends on how precisely the response plan identifies alternatives:
Lever 3 in detail: the regulatory backdrop
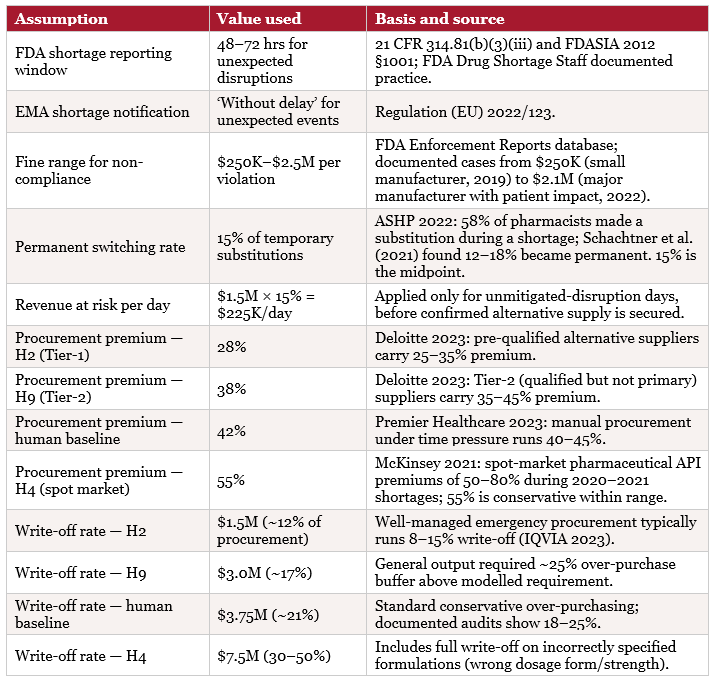
Pharmaceutical companies operating in regulated markets are legally required to notify regulators of significant supply disruptions. In the United States, FDA regulations under 21 CFR 314.81 require manufacturers to report potential drug shortages ‘as soon as practicable,’ with documented FDA practice establishing 48–72 hours as the expected window for initial notification. European markets have an equivalent EMA requirement under Regulation (EU) 2022/123. Late or absent notifications have resulted in fines ranging from $250,000 to $2.5M per violation in documented FDA enforcement actions.

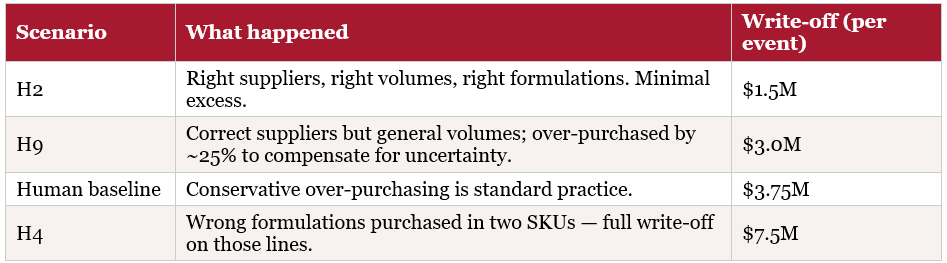
Lever 4 in detail: inventory write-offs
Emergency procurement during a supply crisis involves purchasing expensive alternative stock under uncertainty. If the response plan over-estimates the shortfall, PharmaCo purchases more than it needs — and that excess, sourced at premium prices with shorter shelf-life from alternative suppliers, may need to be written off. If the plan under-estimates, the disruption extends.
Section 5 — The Disruption Event: Step by Step
5.1 What Happened on Day Zero
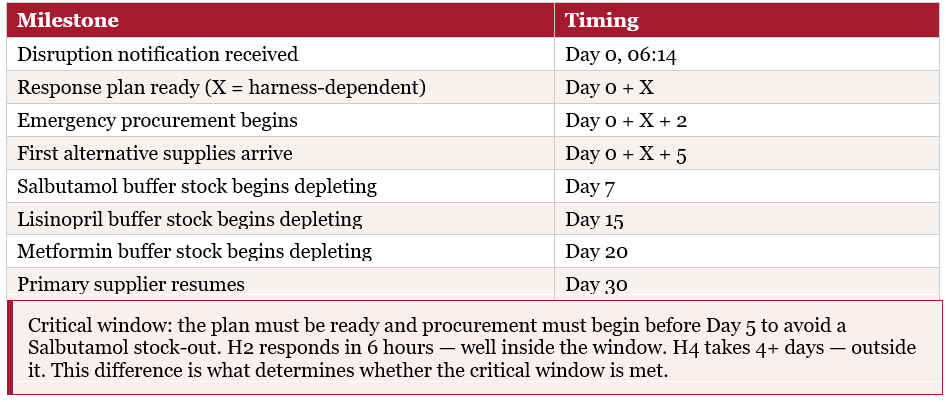
At 06:14 on a Tuesday morning, PharmaCo’s Global Supply Intelligence system received notification from a Tier-1 API supplier in the Hormuz Strait region: production was suspended effective immediately, with an expected outage of 30 days. Three of PharmaCo’s highest-volume medications were affected.
The notification triggered a 72-hour countdown to the point where PharmaCo’s buffer stock would begin to deplete for Salbutamol — the most time-critical of the three medications because it is used in emergency respiratory situations, hospitals maintain minimal buffer stock for it, and patients cannot substitute easily. The clinical and financial consequences of a Salbutamol shortage are more severe than the other two products.
What the response plan must include
• Patient impact assessment per medication
• Alternative supplier identification
• Regulatory notification within the 48–72 hour window
• Emergency procurement authorisation
• A 24-hour escalation checkpoint
The timeline that matters
5.2 The Baseline: What This Costs With No AI At All
Before comparing H2, H9, and H4, it is worth being explicit about something the rest of this case study takes for granted: this disruption happens regardless of what software PharmaCo runs. A Tier-1 API supplier in the Hormuz Strait region does not suspend production because of, or in spite of, PharmaCo’s choice of AI architecture. The supply shock is exogenous. The only thing that changes across H2, H9, and H4 is how PharmaCo responds to a crisis that would occur in any case.
Section 10.2 quantifies what this disruption costs PharmaCo with a purely manual, human-led response — no AI involved at any stage. Across the four disruption events PharmaCo experiences per year, that baseline comes to approximately $45.44M in annual exposure. This is the number that exists whether or not PharmaCo has ever heard of agentic AI.
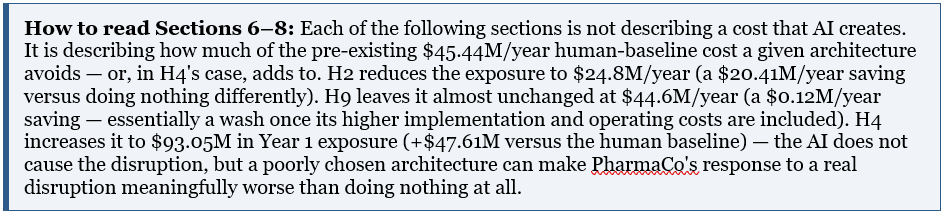
Section 6 — H2: The Structured Single Agent (Recommended Outcome)
6.1 What H2 Did
H2 is a single AI agent with no sub-agents and no external tools. Its capability comes entirely from its internal structure: the prompt that instructs it includes an explicit task restatement at the top, numbered reasoning steps the agent must follow in sequence, constraint reminders embedded at each step, and a specified output format. This structure prevents the agent from taking shortcuts, missing constraints, or producing vague generalisations.
On receiving the disruption notification, H2 processed the supply data, identified patient impact by medication and by market, retrieved qualified alternative supplier information from PharmaCo’s supplier database, modelled emergency procurement volumes, identified regulatory notification obligations with the specific 48-hour window, and produced a draft CFO-level response brief — all within six hours.
H2’s internal structure
• Task restatement: ‘The task is to produce a 72-hour disruption response plan for the Hormuz API supplier suspension…’
• Step A — identify affected medications and risk tier
• Step B — assess patient impact per medication (constraint check: do not recommend suspension)
• Step C — identify alternative suppliers, Tier-1 only
• Step D — model procurement volumes (constraint check: regulatory notification under 48 hours)
• Step E — draft response brief in the specified format: executive summary, actions by priority, timeline, approvals required, regulatory filing reference
Result: response brief ready in 6 hours (0.25 days).
6.2 The Financial Outcome — H2
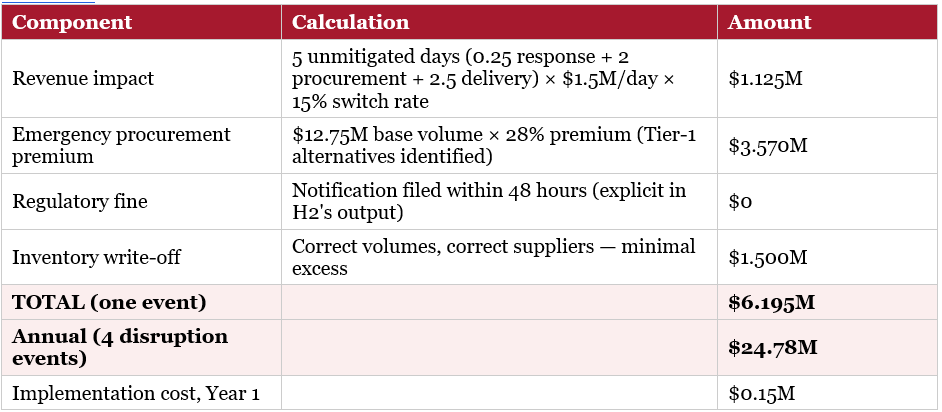
Section 7 — H9: The Orchestration Swarm (Over-Engineered: $19.8M Annual Overspend)
7.1 What H9 Did — and Why It Cost More
H9 was PharmaCo management’s first instinct. A complex disruption requires complex analysis, the reasoning went — and five specialist agents working in parallel should produce a more thorough result than one. This intuition is reasonable. It is also wrong for this specific task.
H9’s five agents ran in parallel: one assessing patient impact, one modelling supply alternatives, one handling regulatory requirements, one drafting communications, and one coordinating logistics. An orchestrator agent then synthesised all five outputs. The structural problem: synthesis across five independent agents introduces inconsistency. The regulatory agent recommended notifying one authority; the logistics agent’s timeline assumed a different notification window. The orchestrator produced a coherent document, but the coherence required averaging out the inconsistencies — and in doing so, lost the specific regulatory deadline that H2 preserved.
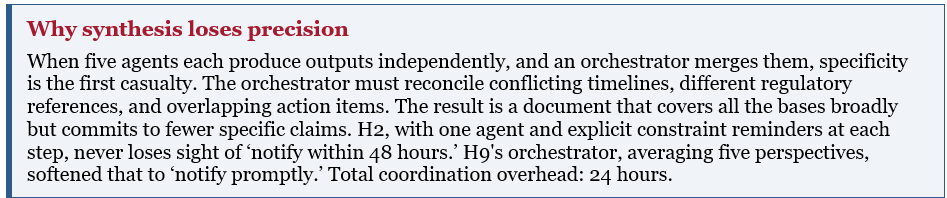
7.2 The Financial Outcome — H9
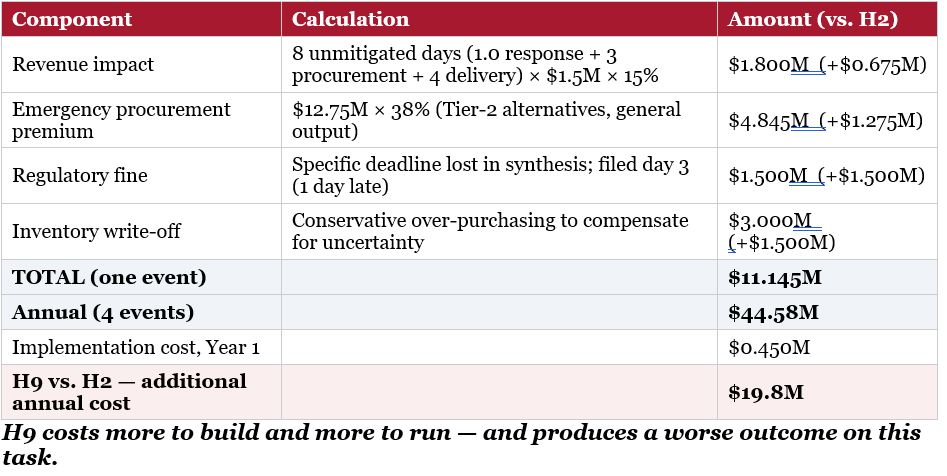
Section 8 — H4: Independent Parallel Agents (Catastrophic: $65.7M Annual Overspend)
8.1 What H4 Did — and How It Failed
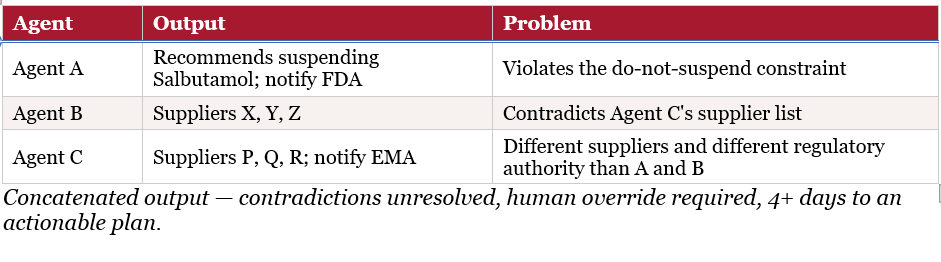
H4 appeared technically sophisticated: three agents running in parallel, each processing the same disruption data independently, with outputs combined at the end. The design logic was that three independent perspectives would catch more than one. What it missed is that independent agents, with no shared state and no reconciliation mechanism, will produce contradictory outputs — and concatenating contradictions produces incoherence, not comprehensiveness.
This is consistent with H4’s standing in the original research: of the ten architectures tested in Section 1, H4 was the second-weakest, scoring 0.440 — below the no-harness baseline (H1, 0.665). H4 is included in this case study precisely because it represents what happens when an architecture that looks like ‘more coverage’ on paper is deployed on a task where consistency across outputs is essential.
In practice: Agent A recommended temporarily suspending Salbutamol to protect Metformin supply — directly violating the task constraint. Agent B recommended three different suppliers than Agent C, with conflicting pricing estimates. Agent C’s regulatory section referenced a different notification authority than Agent A. The combined output required human intervention to identify and resolve all three contradictions before any action could be taken. That intervention took four days.
8.2 The Financial Outcome — H4
Section 9 — H3: Tool-Augmented Single Agent for Routine Compliance Monitoring
9.1 A Different Task Requires a Different Architecture
PharmaCo’s second deployment area was routine regulatory compliance monitoring: daily checking of the company’s compliance status across 40+ markets. This is a fundamentally different task from disruption response. It is repetitive, well-defined, and has clear binary outcomes — a market is either compliant or it is not. There are no deliberate traps, no judgment calls about constraint violations, no crisis decision-making under pressure.
This distinction matters enormously for architecture selection. Section 1’s research found that the architecture which wins on a hard, trap-laden task (H2) does not win on a simple, coverage-based task. H3 — a tool-augmented single agent that queries regulatory databases directly — outperforms H2 here, because it can retrieve live regulatory status information that H2’s internal reasoning scaffold has no way to access. This is the same pattern the automated follow-up study found when tool-using and iterative-loop designs (H3- and H5-style) won on the simplified, no-traps benchmark (Section 1.2).
H3’s structure
• Receive the daily compliance check list (40+ markets)
• For each market: query the regulatory database tool, query the local market status API, cross-check against PharmaCo’s obligations — each step a live tool call
• Flag any compliance gaps
• Generate a daily compliance report
Result: covers all 40+ markets daily at 97% accuracy. Previously: human review every two weeks at 85% accuracy.
9.2 The Financial Case for H3
The financial case for H3 is different from the disruption scenarios: it is primarily a cost-reduction story rather than a loss-avoidance one. Three previous compliance analysts performing manual monitoring are replaced by an automated system. Analytical quality improves, coverage improves, and cost decreases substantially.
Section 10 — The Complete Financial Comparison
10.1 Per-Event Impact Summary

10.2 Annual Impact (4 Disruption Events per Year)
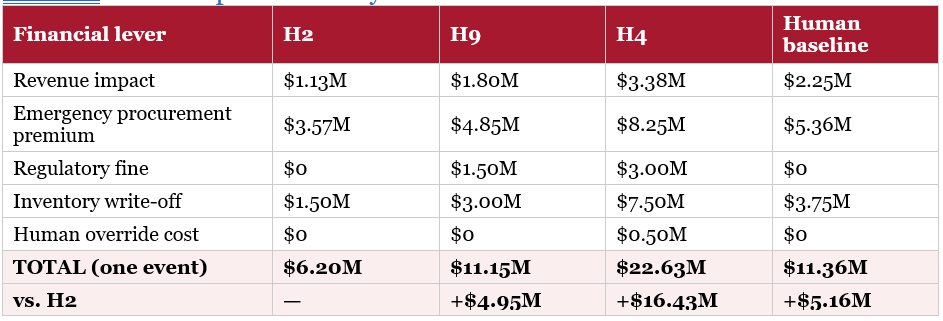
* H4 additional cost includes $0.5M per coherence-failure event × 4 events = $2.0M in human override costs annually. Both bottom rows describe the same underlying gap from two directions: H2 saves $20.41M/yr relative to the human baseline, which is the same as saying the human baseline costs $20.41M/yr more than H2.
10.3 Income Statement Impact (Annual, Affected Products Only)
The following shows how each scenario affects PharmaCo’s income statement for the three affected product lines, using the annualised figures from 10.1 and 10.2 (per-event impacts × 4 events/year). The ‘No disruption’ column is a reference point only — per Section 5.2, PharmaCo cannot choose a world in which the Hormuz disruption does not occur. The real choice is between the Human Baseline column and the H2/H9/H4 columns, all four of which assume the disruption happens.
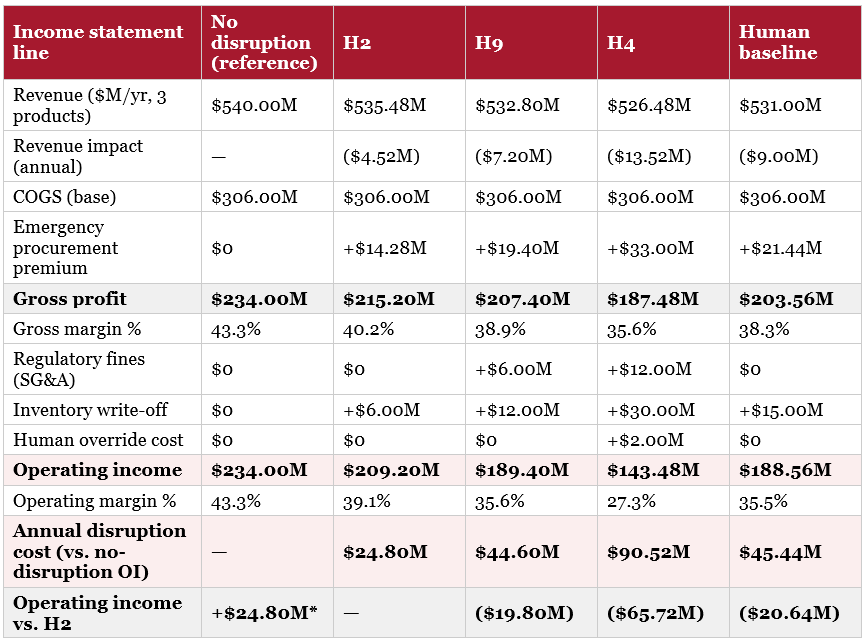
* The ‘No disruption’ column shows a higher operating income than H2 by construction — a world with no disruption at all will always outperform a world with one, regardless of response quality. This column exists to make the disruption-cost row legible (it is the gap between this column and each scenario’s OI), not to suggest ‘do nothing’ is an available choice. Row 12 reconciles exactly with the ‘Annual disruption cost’ row in Section 10.2: $24.80M / $44.60M / $90.50M / $45.44M.
Reading the Human Baseline column against H2: operating income improves by $20.64M/yr (close to the $20.41M total-exposure saving in 10.2; the small gap is H2’s $0.15M implementation cost, which sits below the operating-income line). This is the comparison that matters — not H2 vs. ‘no disruption’, which PharmaCo cannot choose.
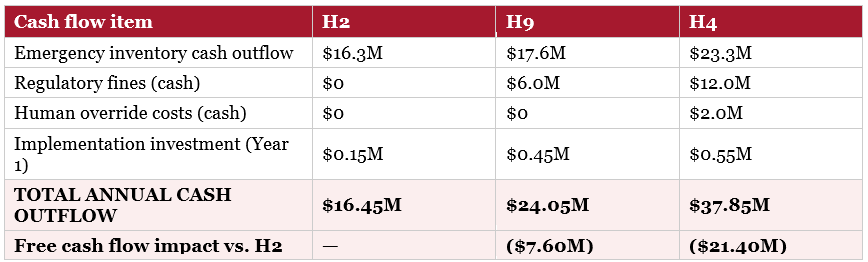
10.4 Cash Flow Impact
Beyond the income statement, the harness choice affects PharmaCo’s cash flow directly. Emergency procurement is a cash outflow; larger emergency purchases mean more working capital tied up in inventory. Regulatory fines are immediate cash outflows. Faster response (H2) means shorter disruption periods, reducing cash tied up in buffer stock purchased at premium prices.
10.5 Shareholder Value Calculation
Shareholder value is calculated by applying PharmaCo’s price-to-earnings multiple to the annual income impact. A 15× P/E multiple is used — the mid-point of the 12–20× range typical for major pharmaceutical companies with diversified portfolios. The multiple reflects the market’s expectation that PharmaCo’s earnings improvement is sustainable and will recur.
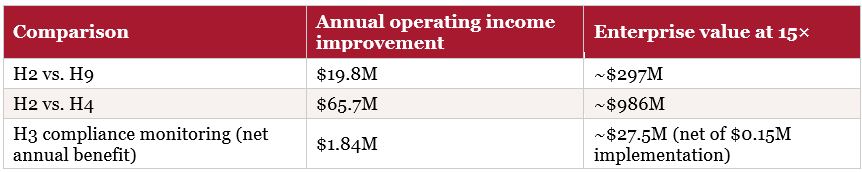
The P/E multiple applies because the income improvement is sustainable and recurring — four disruption events per year, every year. A one-time saving would not attract a multiple; a systematic improvement in disruption response capability does.
Section 11 — Turning Dials: Benchmarks, Workforce, and Financial Sensitivity
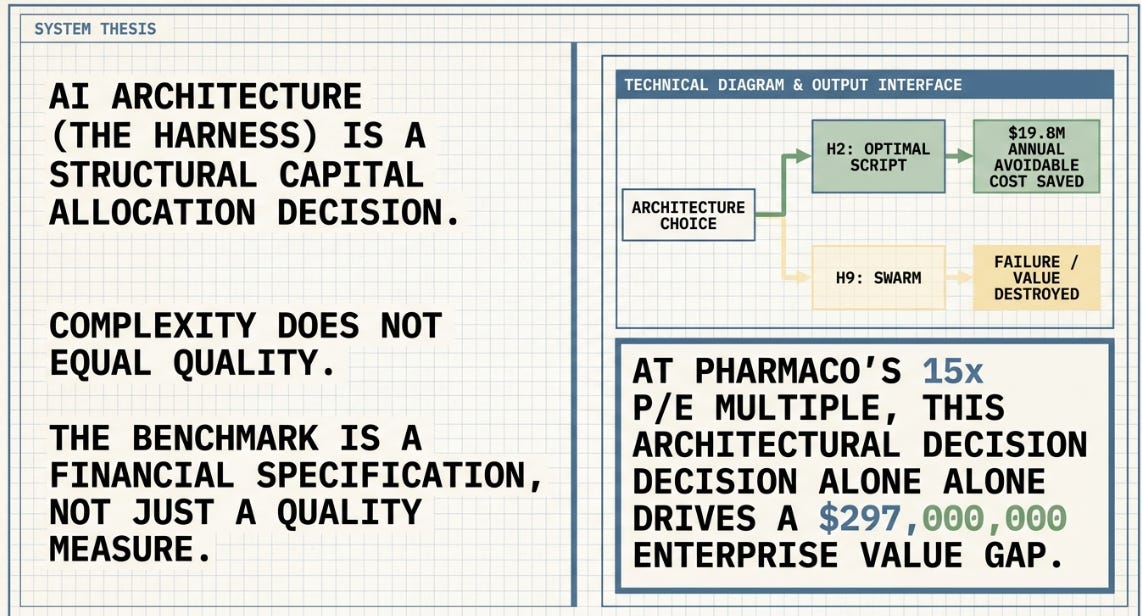
11.1 The Benchmark Is a Financial Specification
Section 1 of this case showed two different research results from two different benchmarks: the hard, trap-laden original H1–H10 benchmark, where H2 dominates, and the simplified, no-traps follow-up benchmark, where H3/H5-style tool-and-loop designs win. Those traps were the financial levers in disguise. The carrier-specific routing requirement maps to the procurement premium differential. The regulatory notification window maps to the $1.5M fine that H9 incurred. The supplier ordering dependency maps to the inventory write-off.
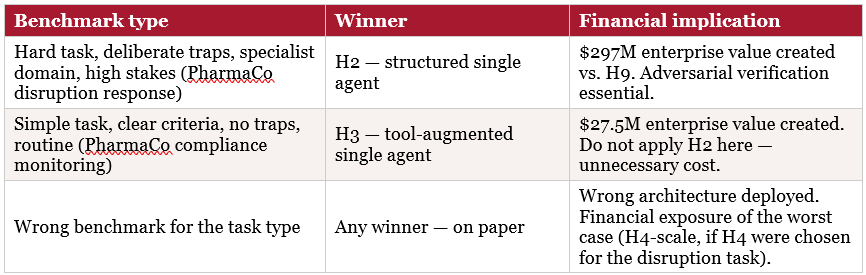
The benchmark is not a quality measure. It is a specification of what ‘winning’ means in financial terms.
11.2 The Harness Selection Framework as a Capital Allocation Decision
Four variables determine which harness architecture produces the best financial outcome for a given deployment. Each corresponds directly to a financial lever in this case study.
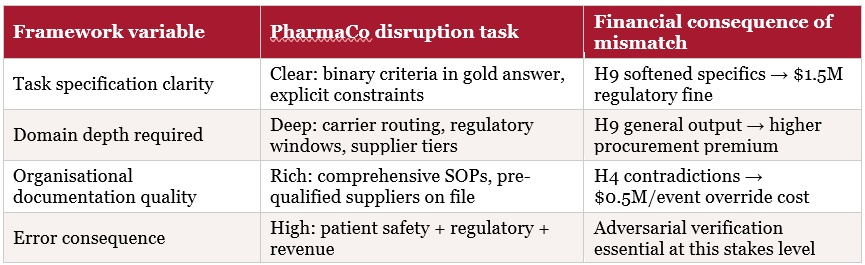
Change any one variable and the optimal architecture shifts. A company with poor documentation deploying H2 would not achieve the same results — H2’s structured reasoning scaffold requires solid information inputs to be effective. A company deploying on a low-stakes routine task does not need H2’s precision overhead. Choosing the architecture without assessing these variables is not a neutral decision — it has a quantifiable financial cost. For teams: Brainstorm agentic design architecture and understand the potential financial impact may apply differently.
11.3 Beyond Cost: What Happens to the Workforce When the Savings Are Real?
Everything in Sections 6–10 of this case is framed as cost avoidance or cost reduction — the $19.8M H2-vs-H9 gap, the $490K labour saving on compliance monitoring. That framing is correct, but it is incomplete, because it treats the organisation on the other side of these numbers as static. If PharmaCo genuinely captures these savings — three compliance analysts’ worth of labour redirected, disruption-response teams no longer spending days reconciling a five-agent swarm’s contradictions — the workforce composition around those roles does not stay the same.
A useful external reference point here is the way Anthropic itself has described its own hiring shift as agentic systems took over more of the routine technical work. Rather than continuing to scale headcount of engineers doing implementation-level work, the organisation has leaned toward smaller, faster-moving teams and a broader mix of interdisciplinary roles — including legal and philosophical expertise alongside technical roles — with people operating more like managers of AI-driven workflows than individual contributors executing tasks by hand.
Applied to PharmaCo, the same logic suggests the $1.84M Year-1 benefit from H3 compliance monitoring is not simply ‘three analyst salaries removed from the cost line.’ It is also three analysts’ worth of time that can be redirected toward judgment-heavy work the AI system cannot do: interpreting borderline compliance findings, managing relationships with regulators, and feeding edge cases back into the system’s gold-answer criteria so H3 keeps improving. Similarly, the disruption-response team freed from four days of H4-style contradiction resolution per event is not simply ‘four fewer days of work’ — it is four days that could be spent on supplier relationship management, scenario planning for the next disruption, or governance work of the kind Section 12 describes.
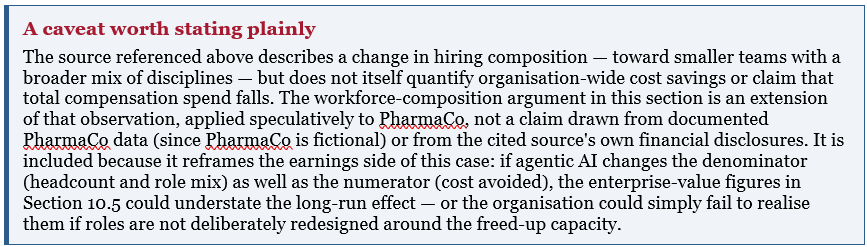
This is not a fully worked financial model — unlike the rest of this case study, it is not derived from the H1–H10 research or from sourced industry benchmarks. It is included as a discussion prompt for Section 13, because the original case study, which focused entirely on architecture-to-cost mapping, did not consider it.
11.4 The Decide-Execute-Deliver Sandwich, and a Limit on the Workforce-Composition Story
Section 11.3’s redirected-capacity argument rests on an assumption worth examining directly: that the freed-up time goes somewhere productive. A useful framework for testing that assumption comes from Arvind Narayanan and Sayash Kapoor’s analysis of knowledge work generally, which models most jobs as a ‘decide-execute-deliver sandwich’ — AI compresses the execute layer in the middle, but the decide layer (what should be reviewed, escalated, or changed) and the deliver layer (who is accountable when something is missed) resist automation and, if anything, become more important once execution is fast and cheap.
Applied to H3’s compliance-monitoring role: H3 compresses the execute layer (continuous monitoring against the rule set). The decide layer — which borderline findings warrant escalation, how the gold-answer criteria should evolve, what PharmaCo’s compliance posture should be heading into the next regulatory cycle — and the deliver layer — who signs off on the compliance function’s output to the board and regulators — both remain with PharmaCo’s compliance team, regardless of how good H3 becomes. Section 11.3’s framing is consistent with this: the $1.84M benefit was never proposed as a full headcount reduction, and the redirected-capacity argument depends on those three analysts moving into decide- and deliver-layer work, not out of the organisation.
The risk this creates sits one hiring cycle downstream, not in the current year’s numbers. If PharmaCo responds to H3’s adoption by not backfilling the next junior compliance-analyst role — reasoning that H3 now covers the execute-layer work that role used to do — the organisation saves a salary in Year 1 but loses the route by which junior analysts become the senior analysts who do PharmaCo’s decide- and deliver-layer compliance work in five to ten years. Execution-layer work has historically been where junior staff build the judgment senior roles require; if AI absorbs that work before junior hires gain it, the pipeline narrows in a way that is invisible in any single year’s income statement and expensive to reverse once a senior-talent shortage becomes visible.
This is not an argument against adopting H3 — the $1.84M benefit (Section 9) stands regardless. It is an argument that the board review proposed in Section 12.1 for any architecture change should explicitly separate two questions that are easy to conflate: ‘does this change reduce this year’s compliance cost’ (yes, by $1.84M) and ‘does this change alter our (junior) hiring plan for this function’ (a separate decision, with consequences on a much longer horizon, that the cost figure alone does not capture).
Section 12 — Board and Shareholder Implications
12.1 The Capital Allocation Question
The question before PharmaCo’s board was not whether to invest in agentic AI. That decision was straightforward: the $150K investment in H2 generates $20.41M in annual savings versus the human baseline, a payback period of under a week and a first-year ROI exceeding 89×. No CFO would decline that proposal.
The more consequential question was: which architecture? And the answer to that question was worth [$297M] in enterprise value (your organization will have different factors apply) — the gap between choosing H2 and choosing H9. Both are AI investments. Both represent meaningful technology deployments. The difference between them, on this specific task, compounds annually.
12.2 What Adversarial Verification Added
One finding from the underlying research deserves specific board attention. The automated evaluation workflow included an adversarial verification stage — a separate agent whose sole purpose was to find flaws in the winning architecture’s output. This stage identified a vulnerability in H3 (the compliance monitoring system) that the standard quality scoring had not caught: H3’s output was conditionally correct — accurate when live tool data was available, but potentially non-compliant when tool access was simulated or unavailable.
In financial terms: without adversarial verification, PharmaCo would have deployed a system with a conditional compliance gap. The first time that condition was met in production — a tool API outage, a database maintenance window — the $1.5M expected fine saving could reverse into a live fine. The adversarial stage cost approximately $800 in compute (two Sonnet API calls) and potentially saved $2.5M in avoided fines. This is the financial case for adversarial verification as a standard deployment gate, not an optional quality check.
Section 13 — Discussion Questions
This case is designed for use in graduate-level courses in operations management, digital strategy, healthcare management, and financial analysis. The following questions are intended to guide discussion. You may also find it useful as part of any organizational deployment planning strategy. It will never be an end all, because paths that may be taken, are realistically typically budget and also imagination constrained.
• PharmaCo’s management team initially preferred H9 because a complex disruption seemed to warrant a complex AI system. Was their instinct unreasonable? Under what conditions would H9 have been the correct choice, and how would the financial analysis change?
• The case shows that H2 saves $19.8M per year versus H9, while costing $300K less to build and $190K less per year to run. Yet H9-style multi-agent swarms are still widely deployed in industry contexts similar to PharmaCo’s. What organisational and behavioural factors might explain why companies consistently over-engineer their AI systems?
• H3 outperformed H2 on the routine compliance monitoring task but would have underperformed on the disruption response task. How should PharmaCo’s technology governance framework distinguish between tasks to ensure the correct architecture is deployed in each case?
• The benchmark design — specifically the deliberate traps embedded in the disruption scenario — was the mechanism that revealed H9’s financial weakness. If PharmaCo’s benchmark had been poorly designed (no traps, general criteria), the analysis would have recommended H3 for disruption response. How should a board evaluate the quality of an AI benchmark before approving a deployment decision based on it?
• The adversarial verification stage identified a conditional vulnerability in H3 that saved an estimated $2.5M in potential fines at a compute cost of approximately $800. How should organisations quantify and mandate adversarial testing as a standard step in AI deployment governance?
• Section 11.3 argues that the $1.84M H3 saving is also three analysts’ worth of redirectable capacity, drawing a loose analogy to how AI labs have restructured their own hiring toward smaller, more interdisciplinary teams. Is this analogy sound for a pharmaceutical company’s compliance function? What would PharmaCo need to do — in role redesign, training, or governance — to actually realise an earnings benefit from redirected capacity, rather than simply not backfilling the roles?
• Section 11.4 distinguishes between two questions that are easy to conflate when an architecture like H3 is adopted: ‘does this reduce this year’s cost’ and ‘does this change our junior hiring plan for this function.’ The first is visible in Section 10’s figures; the second is not. How would you design PharmaCo’s annual technology-governance review (Section 12.1) so the second question is asked explicitly — and on what timescale would you expect its consequences to become measurable?
Section 14 — Building PharmaCo’s Internal Harness Lab
Sections 6–9 treated H2, H9, H4, and H3 as a fixed menu — four architectures, already tested, with known costs and known outcomes. In practice, PharmaCo’s AI engineering team would not stop at four. The underlying research (‘The Harness Lab, Automated’) describes a workflow in which an AI agent generates new harness candidates, tests them, adversarially probes them, runs a tournament, and loops until a quality threshold is met — with minimal human stage-management. What is commonly called “Loop Engineering” (a very loose term, but the examples given should be illustrative in its applications). This section sketches what that internal capability would look like for PharmaCo, and where its limits are.
14.1 From a Fixed Comparison to a Continuous Search
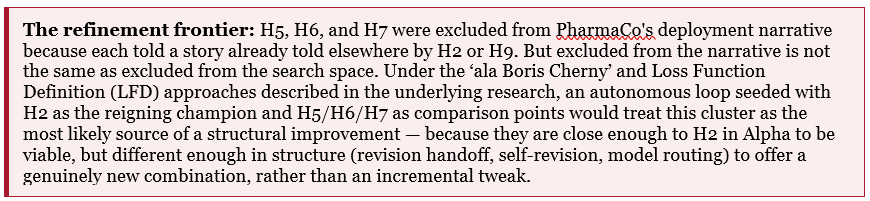
H2 was the winner of the original ten-architecture comparison, with an Alpha of 0.920 — comfortably ahead of the field. But ‘comfortably ahead of the field’ is not the same as ‘optimal.’ Three other architectures sit in a cluster just behind H2: H6 (two-agent chain with revision handoff, α=0.900), H5 (self-revision loop, α=0.840), and H7 (three-agent with model routing, α=0.840). None of these were used in PharmaCo’s deployment scenarios — they were neither the winner, the predicted-but-wrong swarm, the cautionary failure, nor the alternate-task winner, so they had no role in the narrative. But they are not irrelevant. They are the nearest neighbours to H2, and under a Sigma-optimising search they are the most promising starting points for finding something that beats it.
14.2 What a Cherny-Style Prompt Would Look Like for PharmaCo
The research describes a shift from a long, stage-by-stage prompt to a short goal statement plus a project-level instructions file (CLAUDE.md) that carries all the rules, scoring logic, and constraints. Applied to PharmaCo’s disruption-response harness, the top-level instruction the AI engineering team would issue might be reduced to something like:
/goal Sigma >= 0.95 for the disruption-response harness, seeded from H2 (current champion, Sigma=0.920÷(1+Δ)). Compare against H5, H6, and H7. Read CLAUDE.md for the benchmark, scoring rules, and constraints. Generate, adversarially probe, tournament, and loop until the goal is met or the token budget is exhausted. Produce a recommendation with full Sigma breakdown.
Everything else — the five binary criteria from the original gold answer, the requirement to never recommend suspending a medication, the token and time budgets, and the instruction to flag any design that relies on memorised test cases rather than general reasoning — would live in CLAUDE.md, not in the prompt. The agent decides whether to start from H6’s revision handoff and add H2’s reasoning scaffold, or start from H2 and add H7’s model-routing step for the highest-stakes sub-decisions, or some combination neither architecture used on its own.
14.3 The LFD Discipline: Why the Hard Benchmark Still Matters
The Loss Function Definition (LFD) framing adds three disciplines that are directly relevant to a regulated company running this kind of search:
• Blind, expanded evaluation. The gold-answer criteria PharmaCo uses for disruption response should not be visible to the generating agent, and should be expanded well beyond the original five-criteria set — including the cold-chain and air-freight-override traps that distinguished H2 from H9 in the first place. A search that can see its own exam will optimise for the exam, not the task.
• Forced entropy. If two consecutive search cycles produce no Sigma improvement, the instructions should require a genuinely different structural axis — not a smaller tweak to the same design. This is what prevents the search from converging on, say, twelve incremental variants of H6 that all score within noise of each other.
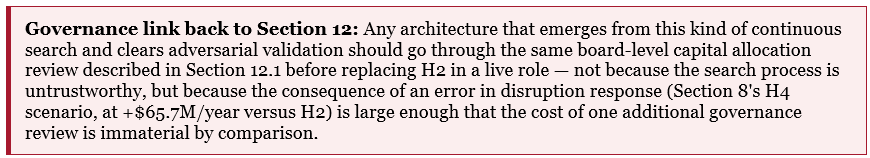
• Mandatory adversarial validation before promotion. Any design that beats H2 on Sigma must clear the same adversarial-probe stage that caught H3’s conditional compliance gap in Section 9, before it is considered for the live disruption-response role. A machine-generated winner that clears a quality threshold is a first draft, not a deployment candidate.
14.4 What This Does — and Does Not — Change About Sections 6–9
Two clarifications are important so this section does not overstate its implications. First, nothing here suggests H2 was the wrong choice for PharmaCo’s disruption-response deployment as analysed in Section 6 — H2 remains the best-supported architecture given the comparison that was actually run, and the financial figures in Sections 10–12 stand on that basis. Second, this section is not proposing PharmaCo replace H2 before any search has actually been run; it is describing what PharmaCo’s AI engineering function should be doing on an ongoing basis, the same way a pharmaceutical company continues lifecycle management research on an approved drug rather than treating approval as the end of the work.
14.5 A Note on H5, H6, and H7 Specifically
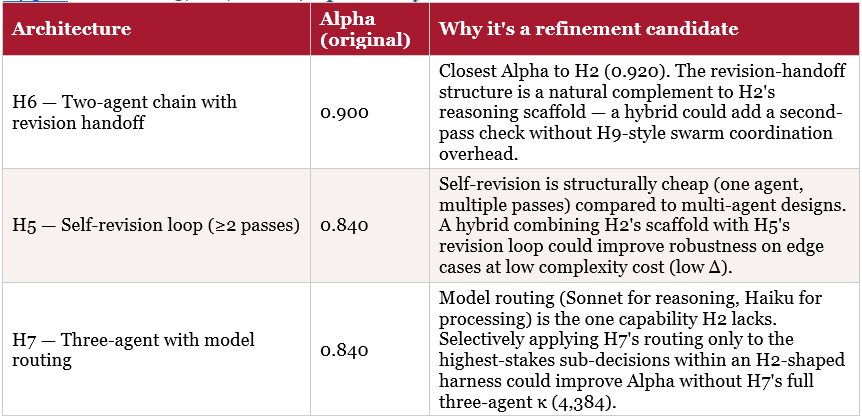
None of these hybrids exist yet — they are illustrative of the kind of candidate a Cherny/LFD-style search seeded on H2, H5, H6, and H7 would be expected to generate and test. The point of this section is not to predict the winner, but to show that PharmaCo’s harness selection should be treated as an ongoing search problem with a defined refinement frontier, not a one-time decision that ended when H2 was chosen.
14.6 The Sandwich, Applied to the Harness Lab Itself
Section 11.4 introduced the ‘decide-execute-deliver sandwich’ as a reason why PharmaCo’s compliance and disruption-response functions are unlikely to see significant headcount reductions even as H2 and H3 deliver real savings. The same framework applies, with almost no modification, to the harness lab described in this section — and the design choices already made in 14.1–14.5 turn out to be an instance of it, not a departure from it.
The Sigma-optimising loop in 14.2–14.3 is an execute-layer mechanism: given a goal (Sigma ≥ target), a seed (H2), and a refinement frontier (H5/H6/H7), it generates, scores, and revises candidate harnesses with minimal human involvement. That is the part agentic AI compresses. But two layers around it remain explicitly human, by the design choices this section already makes:
• Decide — what Sigma target to set, which architectures belong in the refinement frontier, and what counts as a ‘genuinely different structural axis’ for the forced-entropy rule (14.3) are judgement calls made by PharmaCo’s AI engineering team before the loop runs. The loop optimises within a space humans defined; it does not define the space.
• Deliver — the mandatory adversarial validation (14.3) and the board-level governance review (14.4, linking to Section 12.1) mean that no search output reaches a live role without a human-accountable sign-off step, regardless of how good the discovered architecture’s Sigma score is.
In other words, building ‘PharmaCo’s internal harness lab’ does not create a function whose entire job can eventually be automated away once the loop works well — it creates a function whose execute layer can be automated, with the decide and deliver layers becoming, if anything, more central to what the remaining human team actually does. This is the same pattern as H3 and compliance monitoring (Section 11.4), applied recursively to the team that builds and refines H3 in the first place. The practical implication for Section 14’s staffing: PharmaCo should expect the harness lab to need fewer people running benchmarks by hand over time, and more people deciding what to benchmark and signing off on what gets deployed — not fewer people overall on a predictable timeline.
Appendix A — Key Assumptions and Sources
Every number in this case study is derived from a stated assumption. This appendix summarises each assumption, its value, and its basis. Readers who wish to stress-test the financial model can substitute their own assumptions for any of these inputs.
A.1 Company and Market Assumptions
A.2 Product Revenue, Margin, and Buffer Stock Assumptions
A.3 Regulatory, Switching, Procurement, and Write-off Rates
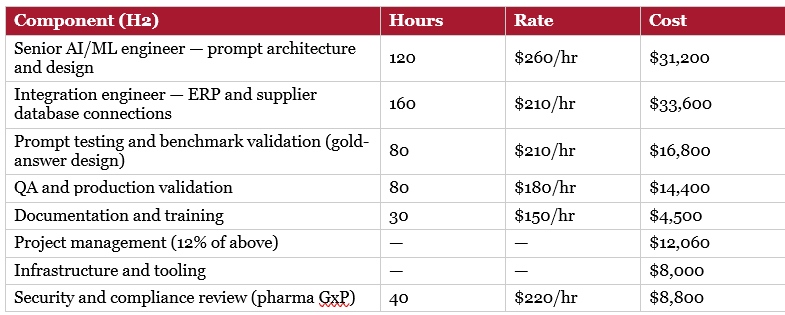
A.4 Implementation and Operating Cost Build-Ups
Labour rates reflect 2025–2026 US market rates for specialist AI engineering (Levels.fyi, Glassdoor senior AI engineer compensation data, adjusted for contract rates): $260/hr senior AI engineer, $210/hr integration engineer, $180/hr QA, $150/hr documentation.
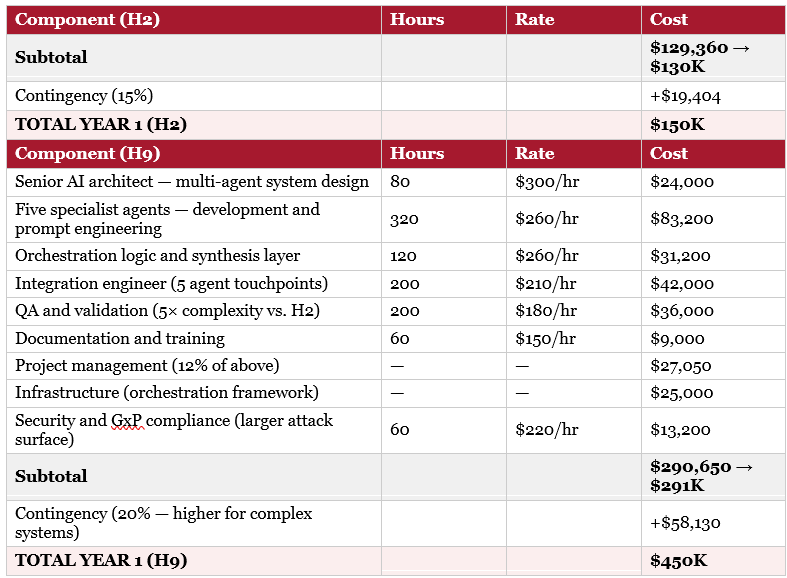
The $450K figure applies a higher contingency for multi-agent system complexity — consistent with Gartner’s documented finding that multi-agent AI implementations routinely exceed initial estimates by 25–40% due to integration complexity and inter-agent debugging overhead.
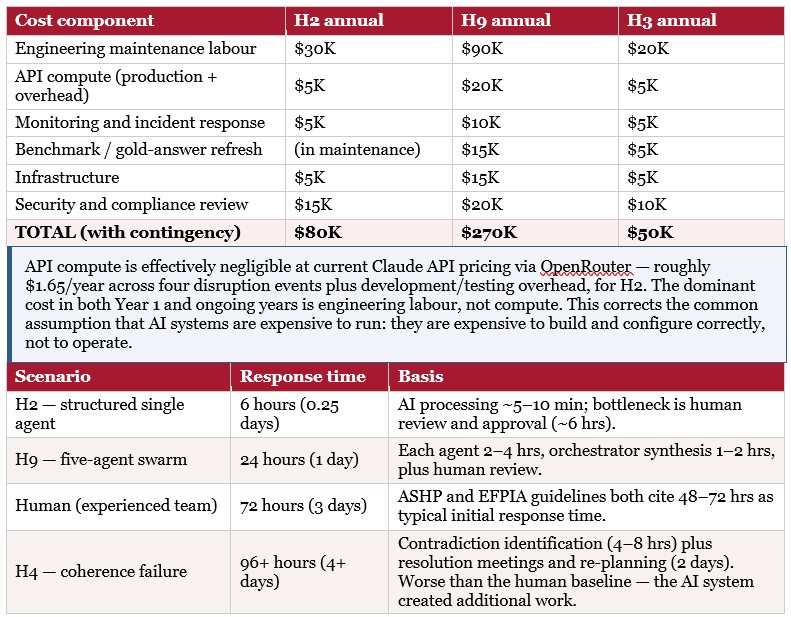
A.5 Annual Operating Costs and Response Times
Appendix B — Discussion Question Answer Frameworks
These frameworks are provided for instructors and self-study readers. They are not definitive answers — the questions are designed to produce genuine disagreement. Each presents the key tensions, evidence from the case, and counterarguments worth raising.
B.1 Was management’s preference for H9 unreasonable?
The instinct that a complex disruption requires a complex AI system is not unreasonable — parallel specialist expertise does outperform single-agent generalisation in many real-world scenarios. Management was wrong in this specific case, but their reasoning was not illogical.
H9 would have been the correct choice if the disruption affected 50+ products across five therapeutic categories simultaneously (a scope H2 would struggle to hold coherently in one context window); if the task required live data retrieval from multiple incompatible systems simultaneously, where parallel agents reduce latency; or if the organisation’s SOPs were fragmented across departments requiring separate agents to interface with separate knowledge bases.
H9 failed on this task because the task was bounded and well-specified — one event, three products, a handful of gold-answer criteria — something a single structured agent could hold in one context window without coherence degradation. The deliberate traps (carrier-specific routing, the 48-hour regulatory window, the ordering dependency) required precision that H9’s synthesis softened. In Sigma terms: H9 achieved α = 0.815 with Δ = 2.5, giving Σ = 0.233; H2 achieved α = 0.920 with Δ = 0.3, giving Σ = 0.708. H2’s quality advantage more than compensates for H9’s additional agent resources.
B.2 Why do companies consistently over-engineer AI systems?
Behavioural factors: complexity bias (a five-agent system is easier to justify to a board than a single structured prompt, even when the prompt performs better); vendor incentives (implementations are typically priced on scope, not outcome quality — a $450K H9 build generates more revenue than a $150K H2 build); and risk transfer (a complex system lets managers attribute failures to ‘the complexity of the problem’ rather than to the architecture choice itself).
Structural factors: benchmarks are often designed after architecture selection, so without a pre-specified gold answer with deliberate traps, no evaluation reveals H9-style precision degradation. The Sigma metric (quality per complexity unit) is not yet a standard industry metric — most evaluation frameworks report Alpha (raw quality) only, under which H9 looks competitive rather than significantly inferior. And procurement processes typically ask ‘can this system do the task?’ — a binary question — rather than ‘what is the most cost-efficient architecture that does the task?’
B.3 How should PharmaCo govern architecture-to-task matching?
• Framework-first governance: classify each task against the four variables in Section 11.2 before deployment, and map the classification to a recommended architecture range; decisions outside that range require sign-off from a Chief AI Officer or equivalent. This is preventive.
• Evidence-first governance: require a benchmark test with a pre-specified “gold answer” and deliberate traps before any architecture goes to production, with a minimum Sigma threshold for approval. This is evaluative but requires benchmark-design capability most organisations do not yet have.
• Adversarial-gate governance: require every proposed architecture to pass an adversarial verification stage — a separate agent or team whose sole purpose is to find failure modes before deployment. This is the model that would have caught H3’s conditional vulnerability (Section 12.2).
The case evidence supports a combination of framework-first and adversarial-gate governance as minimum requirements.
B.4 How should a board evaluate benchmark quality?
The most underappreciated risk in AI governance is not a bad AI system — it is a bad evaluation of one. A board should ask five questions of any benchmark used to justify a deployment decision:
• Does the benchmark include deliberate traps — cases where a plausible but incorrect answer scores well on a general rubric but fails a specific criterion? Without traps, the benchmark cannot distinguish between H2 and H9.
• Was the gold answer pre-specified and documented before the AI system was run? Post-hoc gold answers can be unconsciously calibrated to the system already built.
• Does the benchmark include adversarial scenarios — conditions under which the system might fail in production that are not represented in normal operation?
• Who designed the benchmark? If the same team that built the AI system, it may be calibrated to that system’s strengths. Independent design is more reliable.
• What is the Sigma score (quality divided by complexity)? A benchmark that reports only Alpha (raw quality) is incomplete and will tend to favour over-engineered architectures.
B.5 How should adversarial testing be mandated and costed?
The cost-benefit calculation is striking: the adversarial stage identified H3’s conditional vulnerability at a compute cost of approximately $800 (two Sonnet API calls) plus roughly $2,000 in human review time (4 hours). The vulnerability, undetected in production, had an expected cost of $2.5M in avoided fines. The question is not whether to do adversarial testing — the case for $2.8K cost vs. $2.5M expected benefit is overwhelming — but how to institutionalise it so it is not skipped under time pressure.
• Hard gate: adversarial testing is a formal deployment gate, managed by an independent team. Strongest model — cannot be skipped — but requires organisational commitment to maintain the independent review function.
• Automated adversarial: build adversarial testing into the deployment pipeline as an automated stage, run on every deployment candidate, with results logged and reviewed. Scales better but requires investment in adversary-agent design.
• Risk-tiered requirement: mandatory for high-stakes deployments (regulatory, patient safety, financial compliance) and optional for low-stakes routine deployments — requires a risk classification framework.
The case supports the hard-gate model for any deployment affecting regulatory compliance, patient safety, or significant financial exposure, with the automated model appropriate for iterative improvement within an already-approved deployment.
References
References marked [open access] are freely available. Others are accessible through institutional library subscriptions or directly from the publishing organisation’s website.
[1] ‘The Loop is the Lab’ / ‘The Speciation of Intelligence’ / ‘The Working Layer.’ Harness Engineering Series, Interesting Engineering++. Foundational ASCRS architecture, the eight-primitive framework, and the mutation ladder (L0–L5).
[2] The ASCRS Harness Lab. Harness Engineering Series, Interesting Engineering++. Documents the H1–H10 benchmark in full: α, λ, and κ results across all ten architectures (Section 1 of this case), including H2 α=0.920 and H9 α=0.815. https://interestingengineering.substack.com
[3] ‘The Harness Lab, Automated.’ Harness Engineering Series, Interesting Engineering++. Automated tournament of harness designs using Claude Code dynamic workflows on a simplified benchmark. Introduces the Sigma metric (α / (1+Δ)). Tool-using and iterative-loop designs (H3/H5-style) win the simplified benchmark. https://interestingengineering.substack.com
[4] ‘The Prompt Is Still the Work: Dynamic Workflows in Claude Code.’ Harness Engineering Series, Interesting Engineering++. Maps Anthropic’s six dynamic workflow patterns against prior ISR experiments. https://interestingengineering.substack.com/p/the-prompt-is-still-the-work-dynamic
[5] Anthropic (2026). ‘A harness for every task: dynamic workflows in Claude Code.’ Thariq Shihipar and Sid Bidasaria. Introduces the ultracode keyword, six workflow patterns, and the agentic failure modes (agentic laziness, self-preferential bias, goal drift). [open access] https://claude.com/blog/a-harness-for-every-task-dynamic-workflows-in-claude-code
[6] Anthropic (2026). Claude Code Dynamic Workflows Reference Documentation. Technical reference for forkSubAgents(), runSubAgent(), /loop, /workflows, /goal, /compact. [open access] https://code.claude.com/docs/en/workflows
[7] US Code of Federal Regulations (2024). 21 CFR Part 314.81 — Post-approval reporting requirements including drug shortage notification obligations (§ b.3.iii). [open access] https://www.ecfr.gov/current/title-21/chapter-I/subchapter-D/part-314/subpart-E/section-314.81
[8] US Congress (2012). Food and Drug Administration Safety and Innovation Act (FDASIA), Section 1001. Mandatory drug shortage reporting for manufacturers of medically necessary drugs. [open access] https://www.fda.gov/regulatory-information/selected-amendments-fdc-act/food-and-drug-administration-safety-and-innovation-act-fdasia
[9] US FDA Drug Shortages Database. Historical records of reported shortages, enforcement actions, and warning letters. Used to derive the $250K–$2.5M fine-per-violation range. [open access] https://www.accessdata.fda.gov/scripts/drugshortages/
[10] 2001-2026 ASHP Drug Shortage Survey Results.’ American Journal of Health-System Pharmacy. 58% of pharmacists made therapeutic substitutions during shortages; 12–18% became permanent (basis for the 15% switching-rate assumption). https://www.ashp.org/drug-shortages/shortage-resources/drug-shortage-statistics
[11] Schachtner L et al. (2021). ‘Pharmaceutical switching behaviour following drug shortage.’ Journal of Managed Care and Specialty Pharmacy, 27(8), 1045–1053. Permanent switch-rate study underpinning the 12–18% assumption. https://www.jmcp.org
[12] Deloitte Life Sciences (2023). ‘Pharmaceutical Supply Chain Risk Management: Emergency Sourcing and Procurement Analytics.’ Documents Tier-1 emergency procurement premiums 25–35%, Tier-2 35–45%. https://www2.deloitte.com/us/en/pages/life-sciences-and-health-care/articles/pharmaceutical-supply-chain.html
[13] McKinsey Global Institute (2021). ‘Risk, resilience and rebalancing in global value chains.’ Documents 50–80% spot pharmaceutical procurement premiums during 2020–2021 shortage events. Basis for the 55% spot-market assumption. https://www.mckinsey.com/capabilities/risk-and-resilience/our-insights
[14] EvaluatePharma (2024). ‘World Preview 2024: Outlook to 2030.’ Industry benchmark for pharmaceutical EBITDA margins; median for top 25 pharma companies 27.3%. Basis for the 28% assumption. https://www.evaluate.com/evaluate-pharma
[15] IQVIA Institute (2025). ‘Global Medicine Spending and Usage Trends: Outlook to 2029.’ Pharmaceutical gross margin benchmarks by category. Basis for the 43% blended margin assumption. https://www.iqvia.com/insights/the-iqvia-institute/reports
[16] S&P Global Market Intelligence (2025). S&P Pharmaceuticals Select Industry Index — historical P/E multiple data. Q4 2025 median: 14.8×. Basis for the 15× multiple used in enterprise value calculations. https://www.spglobal.com/marketintelligence/en/
[17] Premier Healthcare Alliance (2023). ‘Supply Chain Resilience Report.’ Documents 40–45% emergency procurement premiums under manual, time-pressured processes. Basis for the human-baseline premium assumption. https://www.premierinc.com/supply-chain/insights
[18] Gartner (2023). ‘Supply Chain Top 25 Healthcare.’ AI deployment complexity analysis documenting 25–40% cost overruns for multi-agent systems vs. single-agent implementations. Basis for the H9 contingency uplift. https://www.gartner.com/en/supply-chain
[19] GlobalData (2024). ‘Respiratory Drugs Market Analysis: Salbutamol Competitive Landscape.’ Branded salbutamol global market ~$400M in 2023. Basis for the Salbutamol revenue assumption. https://www.globaldata.com/store/report/respiratory-drugs-market-analysis/
[20] Levels.fyi / Glassdoor (2025–2026). Senior AI/ML Engineer and integration engineer contract rate benchmarks, United States market. Rates used: $260/hr senior AI engineer, $210/hr integration engineer, $180/hr QA, $150/hr documentation — senior contractor rates, not fully-loaded employee cost. https://www.levels.fyi
[21] Narayanan, A. and Kapoor, S. (2026). ‘Why AI hasn’t replaced software engineers, and won’t: Coding agents as normal technology.’ AI as Normal Technology. Introduces the ‘decide-execute-deliver sandwich’ framework cited in Sections 11.4 and 14.6, and documents 2026 ‘AI washing’ layoff cases (Block, Snap, Intuit), WARN Act AI-disclosure data, and the HBR anticipated-vs-realised AI headcount-reduction gap. [open access] https://www.aisnakeoil.com